SCALE Developer Tools
SCALE is more than a compiler. Its suite of developer tools make both humans and agents more productive.
Profiler
See where the time goes.
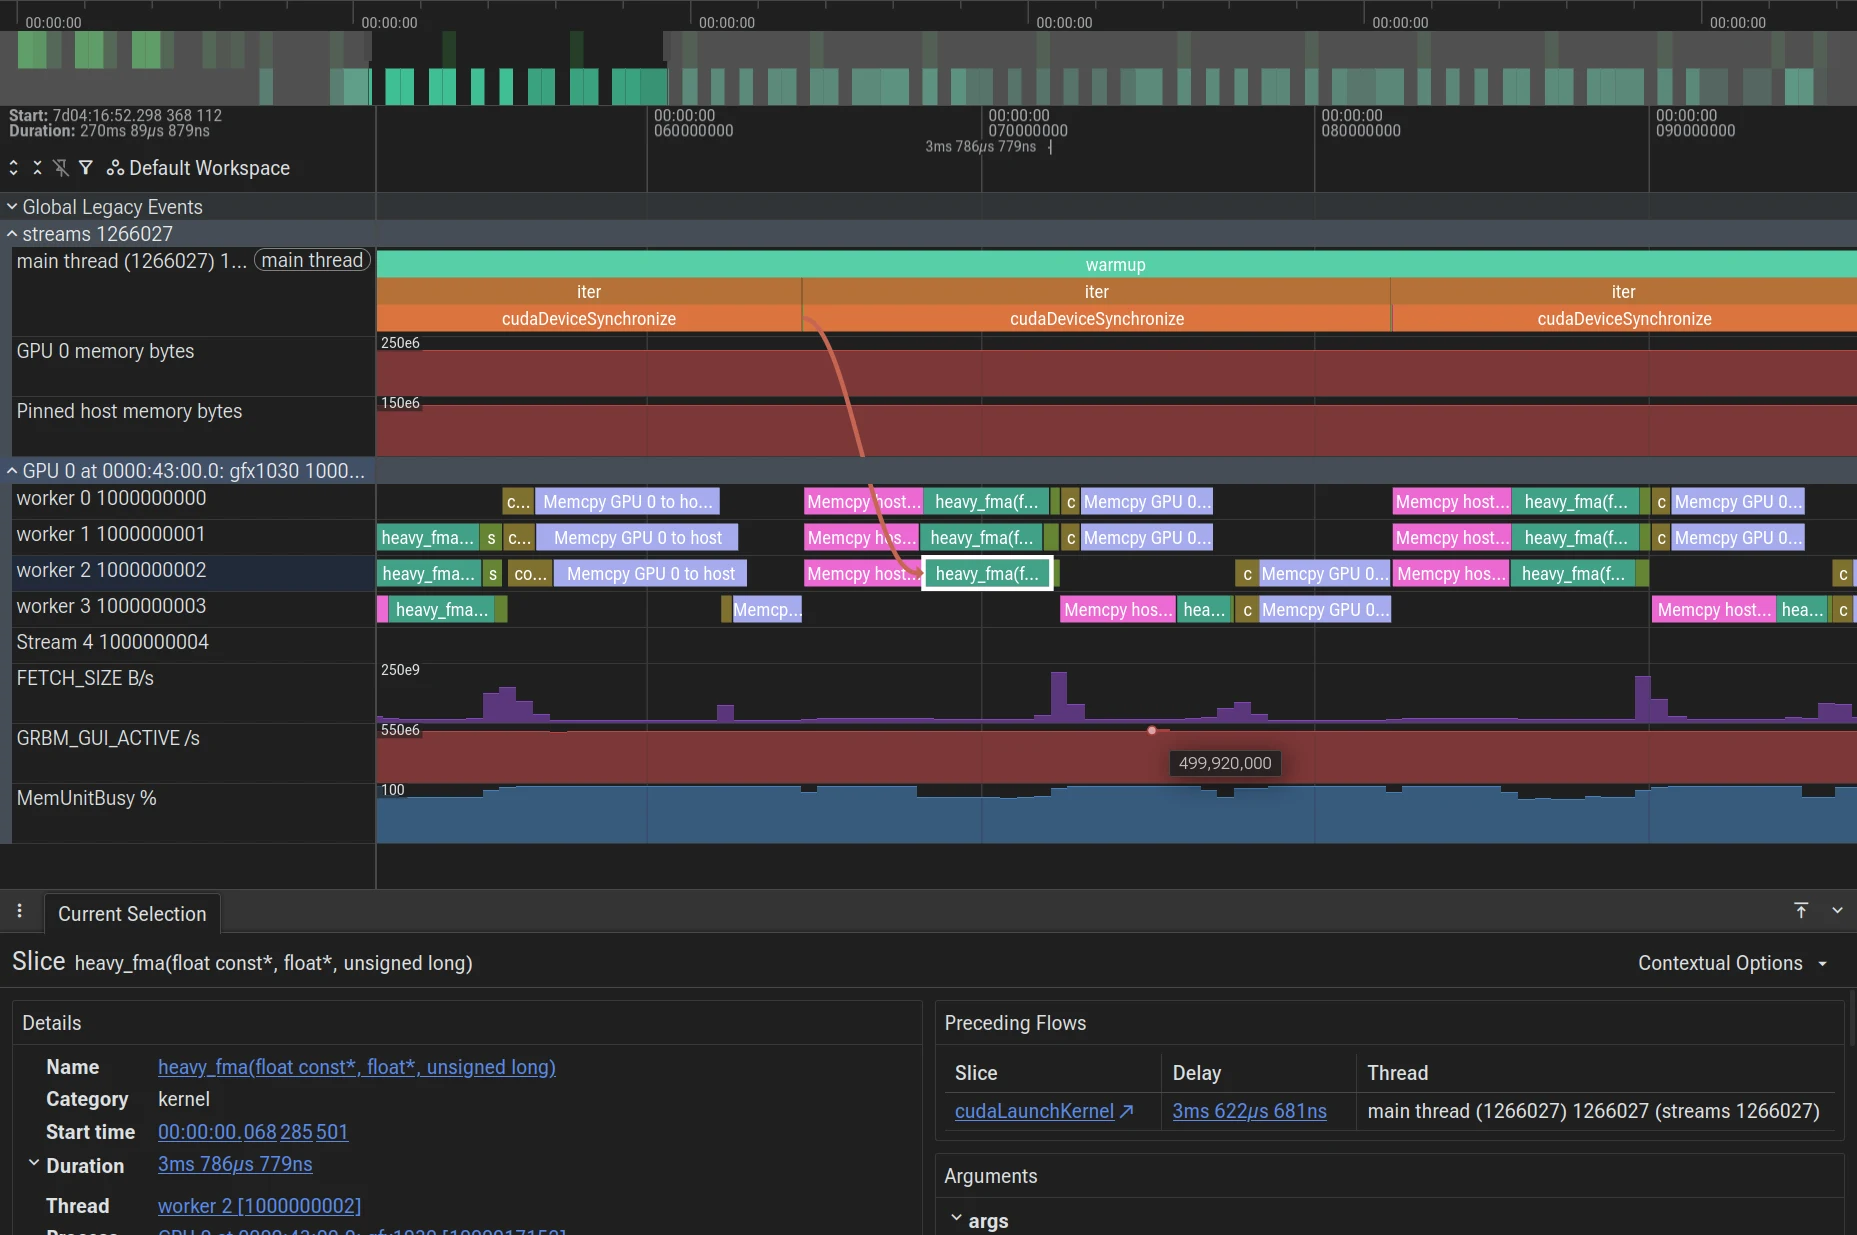
scaleprof produces timelines or reports of where the time is spent in your program.
- A timeline of every stream, with arrows from each host API call to the GPU work it launched.
- Hardware performance counters, sampled across the whole run or measured per kernel.
- Memory allocations, stream waits, CUDA graph launches and their dependencies.
- Implicit synchronisation flagged when they hold things up.
- Standard Perfetto traces: works with standard tools.
$ scaleprof run --view ./showcase
Wrote showcase.scaleprof
Wrote showcase.json

Top kernels by GPU time (4.961 ms in 20 launches)
  note: kernels overlapped; the GPU was busy for 4.372 ms of their 4.961 ms
  40.2%  1.996 ms   6x  void blur<float, 3>(float const*, float*)  25.7%  1.277 ms   1x  void blur<double, 2>(double const*, double*)  18.8%  0.935 ms   6x  sharpen(float const*, float const*, float*, float)  12.8%  0.637 ms   6x  histogram(float const*, unsigned int*)   2.3%  0.116 ms   1x  void blur<float, 1>(float const*, float*)Open in browser (Ctrl-C to stop):
  showcase.json  https://ui.perfetto.dev/#!/?url=http://127.0.0.1:9001/showcase.json
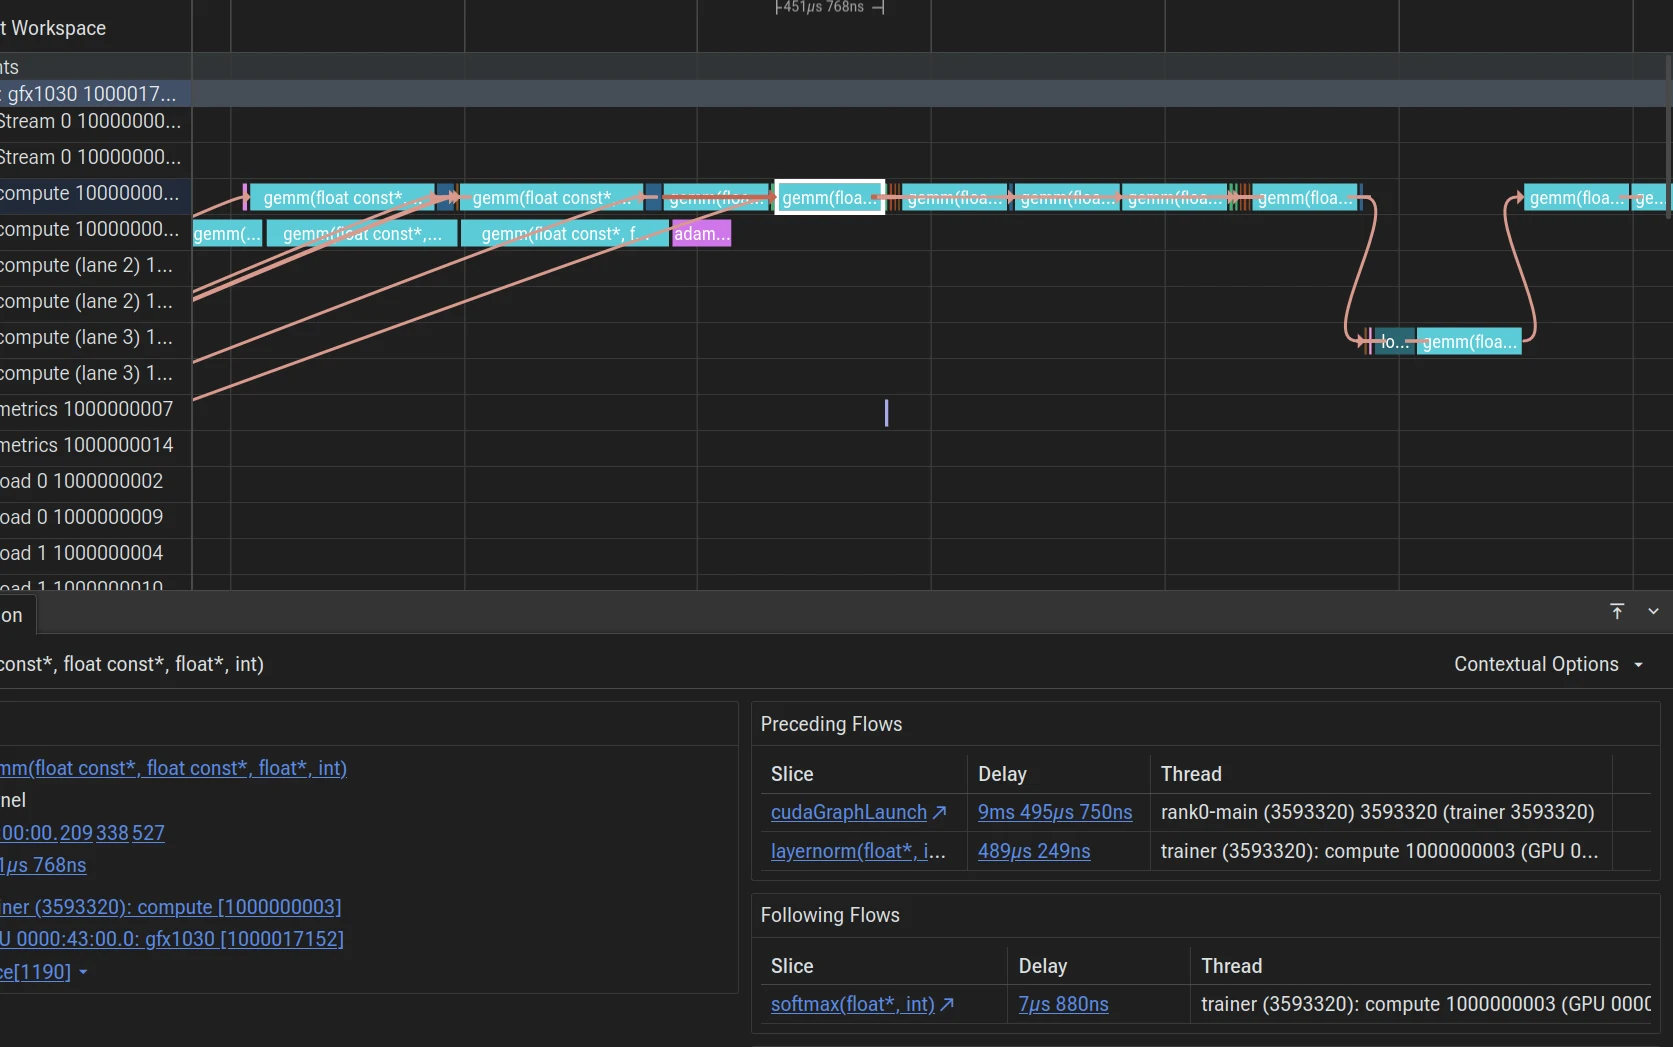
Trace the critical path
Arrows connect API calls to the kernels they launch or synchronise with (including implicitly), making it easy to spot accidential synchronisation points.
Editor support
An editor that understands your CUDA.
SCALE's clangd understands nvcc-dialect CUDA and inline PTX, allowing itsuse with projects incompatible with stock clang.
- Errors and warnings as you type, in host and device code.
- Inline PTX parsed and checked.
- Works with any editor that supports clangd (ie. all of them).
Compiler diagnostics
Mistakes caught at compile time.
Inline PTX is common in CUDA programs, because it is the only way to reach certain hardware features. SCALE parses and checks it properly, so mistakes are reported clearly at compile time.
Trivial Mistakes
SCALE explains even trivial mistakes clearly:
Truncated Pointer
A common mistake is to pass a C++ pointer directly into a PTX asm block:
Multiple Definitions
A function that declares a PTX variable but is inlined repeatedly will cause strange errors due to the variable declaration being duplicated:
__device__ int ptxAdd(int x, int y) {
    int out;
    asm("add.u32 %0, %1, %2" : "=r"(out) : "r"(x), "r"(y));
    return out;
}
error: missing semicolon in inline PTX
    4 |    asm("add.u32 %0, %1, %2" : "=r"(out) : "r"(x), "r"(y));
      |                         ^
ptxas /tmp/tmpxft_001e4e3c_00000000-6_add.ptx, line 28; fatal   : Parsing error near 'st': syntax error
ptxas fatal   : Ptx assembly aborted due to errors
Ask the compiler why your code is slow.
A profiler shows you that a kernel is slow. SCALE’s optimiser remarks tell you why, for problems that are otherwise very hard to diagnose.
- Stack spills that aren’t about register pressure
- When a variable ends up in slow stack memory because of how the code is structured, rather than because the kernel ran out of registers, SCALE says which variable it was and why. You can restructure the code to fix it, instead of chasing register counts.
- Matrix-multiply asm that couldn’t be translatedExperimental
- SCALE automatically translates inline matrix-multiply assembly to the target’s own instructions. When a translation fails, a remark explains why, so you can see what to change instead of silently losing performance.
Humans and agents
Good feedback makes agents better programmers, too.
A coding agent improves its code the same way you do: by trying something and reading what the tools say back. The clearer that feedback, the fewer attempts it takes.
Errors an agent can act on
A clear diagnostic that names the problem and where it is turns a failed build into a one-step fix, instead of guesswork from a cryptic assembler error.
Code intelligence in the loop
Coding agents that use language servers get the same view of your CUDA as you do in your editor, including device code and inline PTX.
Profiles in an open format
scaleprof prints a plain-text summary and writes standard Perfetto traces, so an agent can profile, change the code and measure again without a human reading charts.